# Debugging
Debugging in Kumologica involves the use of tracing to record information about a flow execution. The information contained in the traces can be used to diagnose problems as well as to understand the behavior and state (message) of each participating node in the flow.
Kumologica tracing is always enabled during local development and disable during cloud deployment. For cloud deployments, it is expected that the developer or administrator will adjust the level of logging to get this kind of insight.
# Understanding traces
Following every single test flow execution, a new traceability thread will be created and found under traces tab in the test section.
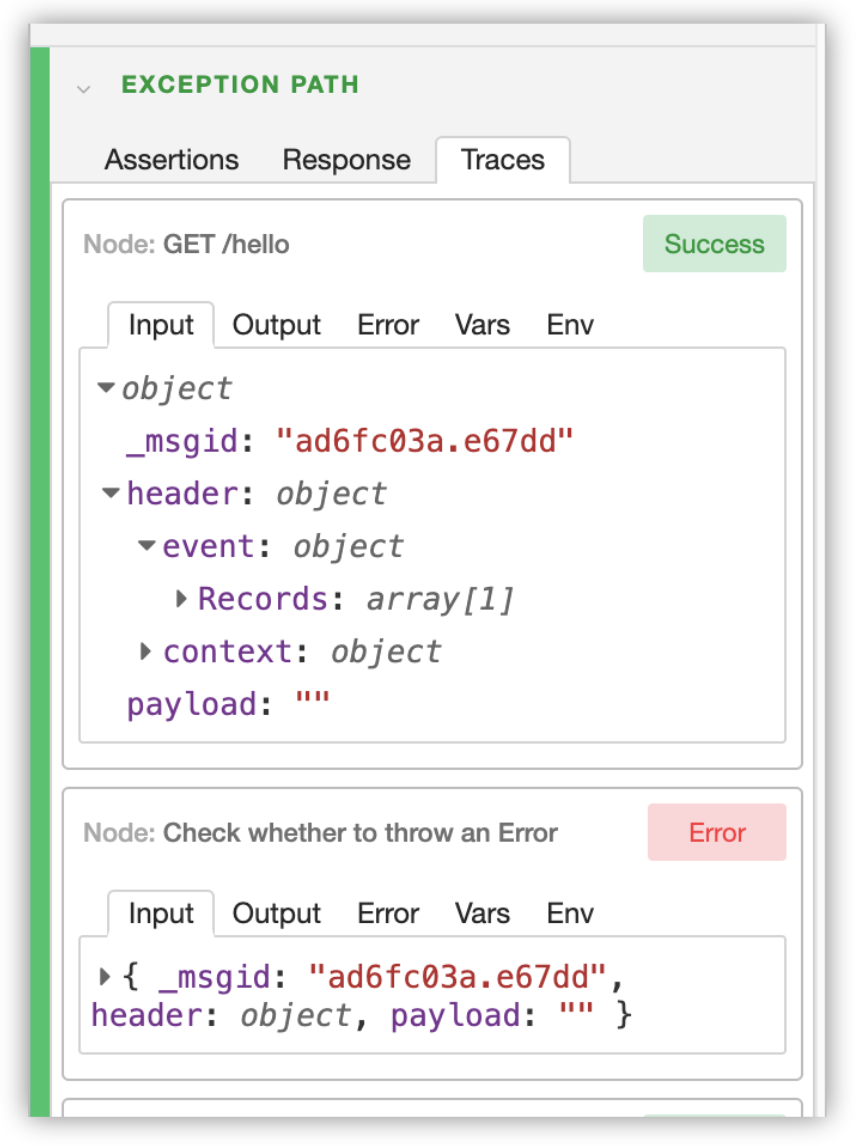
Each node that has participated during the execution of the flow will be represented as a trace, including the following information:
- Name of the node
- Status of the node, either Success or Error
- Input Tab: containing a copy of the message received as an input
- Output Tab: containing a copy of the message sent as an output
- Error Tab: Describing the error occurred, if any.
- Vars Tab: A copy of the
varobject prior the node finished its execution. - Env Tab: A copy of the
envobject prior the node finished its execution.
Following is an example of how the traceability look like in Kumologica Designer: